The recent fiasco with AF-4 Cyclone guide has reminded me that a mere possibility of a weapon’s recoil being less stable doesn’t necessarily mean it will be less stable on average.
Let me remind you the raw numbers:
| Statistic | Cyclone |
Armistice | Eridani |
| Horizontal Recoil | 0.212 / 0.4 | 0.347 / 0.376 | 0.3 / 0.392 |
| Horizontal Recoil Tolerance | 0.9 (2-3 kicks) | 0.9 (2 kicks) | 0.9 (2 kicks) |
Compared to other 1st generation SMGs, the Cyclone has bigger difference between minimum and maximum recoils. It can also potentially have an extra recoil kick, increasing the total width of the recoil pattern.
That led me to conclude that Cyclone has less stable horizontal recoil.
It is true that potentially Cyclone can kick further from the start than other 1st gen SMGs.
However, statistically, it is very unlikely. The probability of several hits in the same direction and with the recoil magnitude being in specific bounds is simply too low to be worth considering.
Discouraged by my error, I have created a tool that will allow to judge the stability of horizontal recoil pattern in an objective manner.
Horizontal Recoil Stability Calculator
This excel spreadsheet will calculate stability of a weapon’s recoil pattern as average distance from the starting crosshair position.
Important! To be able to open this file, you will need a Microsoft Office with enabled Excel Macros. Supposedly there are security risks for doing this. Responsibility is yours, though I promise there’s nothing malicious in specifically my excel files.
How to use
Enter the weapon’s Horizontal Recoil stats into the three orange boxes at the top (where to get stats?). It’s fine to leave Burst Length and number of Simulations to their default values.
Click “Calculate Stability” button, and the sheet will automatically update all results and the recoil distribution graph.
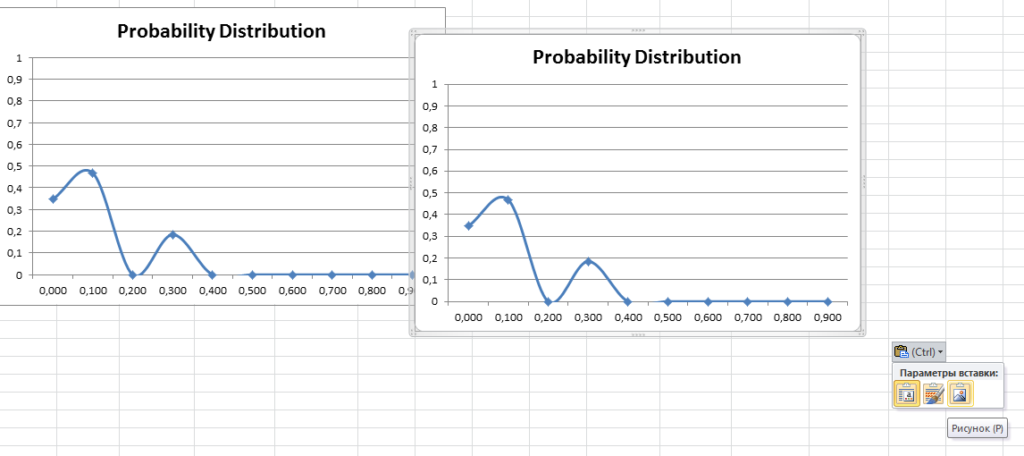
The Probability Distribution graph is your main instrument for assessing weapon’s horizontal recoil stability.
The horizontal axis of the graph represents the distance from the center of the recoil pattern, and the vertical axis represents the probability of that position being chosen.
“Graph Scale H” defines the horizontal scale of the graph. It is set to “1 degree” by default, and generally it should be high enough for all PS2 infantry weapons. For weapons with low horizontal recoil and low tolerance values, you can reduce Graph Scale H to 0.5 to make the graph more accurate.
Ideally, you want a weapon whose graph looks like this:
Basically, a weapon without horizontal recoil whatsoever.
The closer the spikes of the graph to the left side, the higher the probability of the crosshair staying near the center of the recoil pattern – near crosshair’s original position at the beginning of a burst.
“Stability” is simply the average distance of the crosshair from the burst’s starting point. The closer it is to zero, the more accurate the weapon is on average.
“Maximum Deviation” is the highest value taken by Horizontal Recoil during simulation.
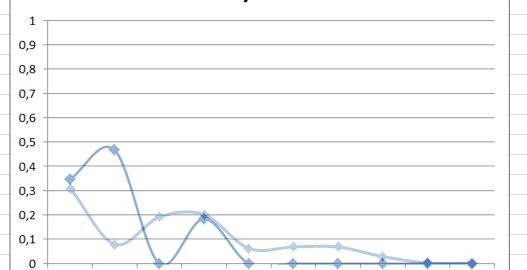
You can copy paste the graph as image in order to compare different weapons:
This is a graph for Gauss SAW.
On the next picture, I’m manually holding it with my mouse over the graph for Cyclone, allowing us to easily compare them.
Returning to Cyclone
| Statistic | Cyclone |
Armistice | Eridani |
| Stability | 0.264 | 0.305 | 0.294 |
| Maximum Deviation | 0.848 | 0.810 | 0.840 |
As you can see, both Armistice and Eridani have lower stability, and a higher chance for the crosshair to be kicked further from the start. While Cyclone will generally shake in wider bounds, half of these bounds is still closer to the center due to lower minimum recoil. Cyclone may be less predictable on small scale, but it will be more stable on average.
Why Excel Sheet?
I’d love to eventually add this functionality into Weapon Simulator, along with other few minor updates, but for the time being I’ve lost the ability to make any additions to it. My Visual Studio died, basically 🙁
